An edition of the Old Bailey Proceedings
The Old Bailey Proceedings are a rich historical resource, almost unimaginably so. They constitute the largest body of texts detailing the lives of non-elite people ever published. Words alone can’t quite do justice to the magnitude of the Proceedings – 197,745 accounts of trials covering 239 years (1674-1913); some 127 million words of text (at an average reading rate of 250 words per minute, this would take eight hours’ solid reading every single day for nearly three years to get through!); details of some 253,382 defendants, including name, gender, age and occupation, as well as details of 223,246 verdicts passed by the juries and 169,243 punishments sentenced by the judges.
The Proceedings clearly contain a huge amount of information, but they don’t record everything – like any historical source, they are selective in what they document. The amount of information that was recorded in the Proceedings on crimes, verdicts, punishments, defendants and so on also varied over time. And whilst the digitization of the Proceedings by The Old Bailey Online has revolutionised the way in which we search and use this rich historical resource, this also has its limits. The marking-up of the text of the Proceedings (assigning tags to particular pieces of information in the text – such as name or crime – so that this information can be systematically searched) makes it possible to undertake sophisticated statistical analysis. Crimes, verdicts, punishments, defendant age and defendant gender can all be counted at the click of a mouse. Nevertheless, marking-up inevitably involves choices (about what information to tag and the level of detail that is tagged), and those choices limit the ways in which the Proceedings can be studied using computers.
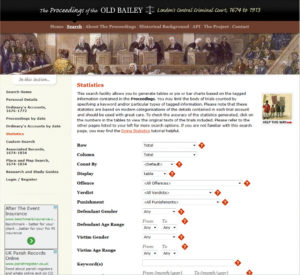
Statistical searches of the Proceedings can be carried out through The Old Bailey Online
The question that we might ask, then, is what are the limitations of the Proceedings as a source of data on such things as punishments, defendant age and gender? Taking the Proceedings in their entirety, what are the limits in terms of the information that was recorded in the original trial reports? How frequently, for example, was the age of the defendant recorded? And what are the limits in terms of what we can actually search for systematically using digital technologies? Can we, for instance, systematically determine the lengths of imprisonment which offenders were sentenced to?
These are crucial questions for us because the Digital Panopticon will rely so heavily on the Proceedings as a source: in our effort to trace the life histories of offenders who were sentenced to transportation or imprisonment at the Old Bailey between 1787 and 1875, the Proceedings will obviously be a vital source of information. After identifying those who were sentenced to transportation or imprisonment recorded in the Proceedings we will then try to trace such individuals both before and after their conviction by linking the Proceedings with other sets of records.
In trying to better understand the limitations of the Proceedings as a source of data for the Digital Panopticon project, I have recently been making use of data visualization (‘dataviz’) – using computers to create visual representations of numbers. This includes the traditional graphs and pie charts that we are all familiar with, and which I will be talking about here. But it also includes more complex forms of visualization which I will be looking at in future posts (watch this space!).
Since the Proceedings contain such a vast amount of information, manual counting and tables are therefore inadequate in making sense of the data. Turning the raw numbers into a visual form makes it much easier to see overall patterns in the data. Here I give just a brief example of how dataviz has helped me to see the Proceedings differently, to appreciate the limits of this immense historical resource, and to think about how information from the Proceedings can be used most effectively in the Digital Panopticon project.
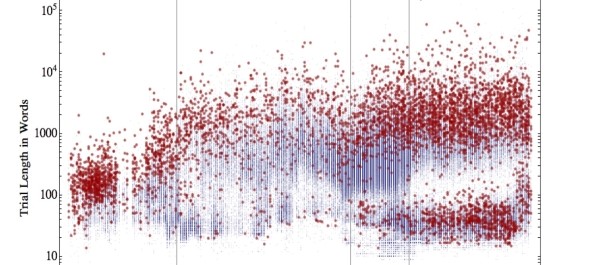
A data visualization of the length of trial reports in the Proceedings over time, created by William J. Turkel as part of the Datamining with Criminal Intent project (created using Mathematica 8)
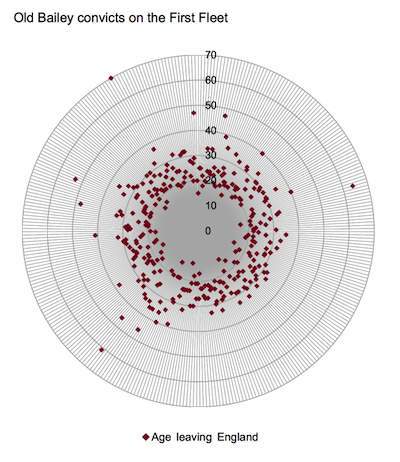
One of the key things we want to know on the Digital Panopticon is how useful age data might be in helping us to link offenders recorded in the Proceedings with individuals documented in other sets of records (such as the convict transportation registers or census records). In the first instance, links will be made through name searches of the different types of records. But how can we be sure that the John Smith recorded in the Proceedings is the same individual as the John Smith recorded in the prison parole registers, for example? Age data might help us here. If John Smith is recorded as being 24 years’ old in the Proceedings at the time of his sentence to two years’ imprisonment at the Old Bailey, and the John Smith recorded in the parole registers is stated to be 26 years’ old, then we can be confident that this is indeed the same person. By the same token, if the John Smith recorded in the parole registers is said to be 60 years’ old, this would suggest not.
Ages could then be extremely useful, but it depends on how extensively, and how accurately, age data is recorded in the Proceedings (and our other sets of records). By visualizing the results of quantitative searches of the Proceedings we can get a clear sense of this, far more so than through the use of text-heavy tables which can be hard to “read” for patterns. A statistical search using The Old Bailey Online reveals that 171,168 defendants are recorded in the Proceedings in the years 1755-1870. Of these, age is recorded for 101,364 (59.3%) of them. So for the entire period of our study, we have age data for just over half of all the defendants at the Old Bailey.
Further digging into the data and visualisation of the findings reveals some of the deeper patterns in the age data. In the first instance, the recording of ages only began in the year 1790 for defendants found guilty, and from the 1860s for those found not guilty, as shown in the graph below. In the 1790s, we have age data for 65% of guilty defendants, increasing to 90% and above thereafter. By contrast, age data for the not guilty is missing until at least the 1850s, and in earnest until the 1860s.
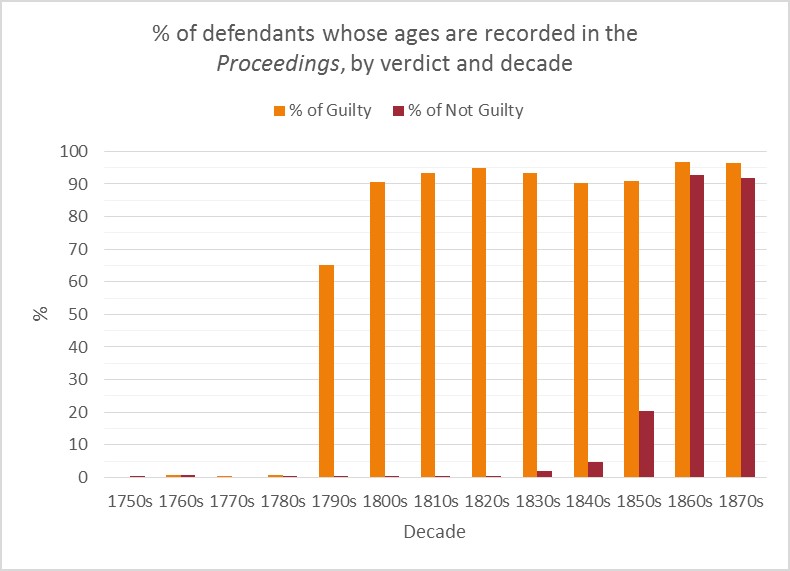
Visualization demonstrating the extent of age recording over time and by verdict
This gives a sense of how extensively ages are recorded in the Proceedings over time, and according to which categories of offenders. By visualizing the patterns of recorded ages we can also get a feel for how ages were actually recorded. The graph below, for instance, suggests that there was a tendency to revise the defendant’s recorded age up or down slightly to match a round figure. The numbers of defendants whose ages are recorded as 30, 40, 50 and (to a lesser extent) 60 are all significantly above the number we might expect according to the moving average (in other words, when the yellow bar goes above the green line in the graph). By contrast, ages just either side of these figures (such as 29, 31, 39, 41 and 51) are systematically below the average (when the yellow bar is below the green line). It may well also have been the tendency for those in their early twenties to have their recorded ages revised down to 18 or 19, since these two ages are also well above the expect number. In short, many more defendants were recorded as being 30 rather than 31, or 40 rather than 41, and the scale of the difference suggests that this resulted from a deliberate policy of revising the defendant’s age up or down to match the nearest round figure.

Visualization demonstrating the “bunching” of recorded ages at 30, 40, 50 and 60
Together this suggests that age data in the Proceedings will be of much use to us in the Digital Panopticon, particularly for the defendants found guilty and subsequently sentenced to transportation or imprisonment. In this instance we have extensive amounts of age data from 1790 onwards. In the case of our not guilty control group, however, we have no age data available in the Proceedings to work with before the 1860s. In this instance we will be reliant on other categories of information to link the not guilty defendants across datasets. And in light of the seeming tendency for recorded ages to be rounded up or down, this suggests that when we use age data to link individuals across datasets it would be more effective to work within age ranges rather than trying to compare specific numbers.
From these early explorations it seems clear that visualization will be invaluable in helping us to identify the overall patterns in the data of the Proceedings. The first step in this is identifying some of the limitations in terms of the information recorded in the Proceedings. Traditional forms of visualization are useful to this end. But there are also potential benefits in going beyond this, by using more complex forms of visualization to uncover deeper patterns in the data – patterns that would be difficult to detect through simple graphs or charts. This is what I will be turning to next.