Author Archives: Sharon Howard

Event: Record Linkage Workshop, Sheffield, 4 November 2014

We’re delighted to be able to announce our second project workshop.

It’s another afternoon workshop, this time in Sheffield, and the subject is Record Linkage (part of the Epistemologies research theme). We’re particularly interested in the challenges and rewards of applying automated (and semi-automated) nominal record linkage to very large-scale historical datasets, with all their variability, fuzziness and uncertainties; our work on the project starts from these questions:

How can we improve current record-linkage processes to maximise both the number of individuals linked across different datasets and the amount of information obtained about each individual? What is the minimum amount of contextual information needed in order to conduct successful large-scale record linkage of data pertaining to specific individuals?

In addition to presentations about our work from project team members, we have three guest speakers who will bring extensive experience of historical record linkage projects:

We think this will add up to a stimulating programme and discussion that will be of interest to many historians who need to link information about large numbers of individuals and using data that is continually growing in diversity and scale.

Download: Workshop Programme/Flyer (pdf).

Workshop Information

When: 2-5.30pm, Tuesday 4 November 2014
Where Humanities Research Institute, Gell Street, Sheffield

Attendance is free but numbers may be limited so you will need to register in advance: email Sharon Howard (sharon.howard@sheffield.ac.uk).

Event: DP @ British Crime Historians Symposium, Liverpool, September 2014

We’re delighted that our quest to take over the entire known universe of the history of crime continues with a panel session at this year’s British Crime Historians Symposium:

The Digital Panopticon: New perspectives on criminal justice records and the practice of transportation

  • Robert Shoemaker, ‘Identifying the criminal: The state and record keeping in the eighteenth and nineteenth centuries’
  • Richard Ward, ‘Seeing things differently: Visualising data on crime and punishment’
  • Lucy Williams, ‘Bound for Botany Bay? Assessing the differences between Old Bailey penal sentences and their implementation’

Event: Digital Humanities Congress 2014, Sheffield

Date: 4-6 September 2014
Location: The Edge, University of Sheffield, UK
Website: http://www.shef.ac.uk/hri/dhc/dhc2014

The Digital Humanities Congress is a conference held in Sheffield every two years. Its purpose is to promote the sharing of knowledge, ideas and techniques within the digital humanities.

Members of the Digital Panopticon project team will be discussing work on the project so far and related themes at this conference, in particular at two AHRC Digital Transformations roundtable sessions (visualising data; scaling up the arts and humanities). See the programme for more details.

Registration is now open and there are early bird discounts until 16 July. There are also discounted rates for postgraduate students.

Visualising Data Workshop Report: part 2

The second half of the workshop was devoted to work in progress and plans for the Digital Panopticon – I’ll say less about these than those in part 1 because longer versions should be appearing (or have already appeared) here on the blog!

Barry Godfrey briefly introduced the project and the challenges of visualisation of our data.

  • we’re looking at systematic changes in punishment over a long period of time (late 18th to early 20th century); but we’re also looking at individuals over their lifetimes and at many thousands of individuals.
  • It’s not just about temporality: we’re also deeply concerned with spatiality – not simply the long distance movement of transportation but movement within Britain.
  • another theme of the project is ethical – the responsibilities of revealing so much information about people: how much does this extend to visualisation too?
  • finally, there are many potential audiences for DP data visualisation – in addition to researchers and academics, students, teachers, genealogists and other non-traditional users of criminal data. How to cater for so many different people and their needs?

Jamie McLaughlin demonstrated some of our early explorations in record linkage and data visualisation, including a number of Sankey diagrams to show connections between two datasets (Old Bailey Proceedings and British Convict Transportation Register). In particular, he’s been comparing the outcomes for defendants sentenced to transportation and those who were sentenced to death which was subsequently commuted to transportation. Another topic of interest is the people sentenced to be transported who don’t subsequently turn up in the transportation records: what happened to them? Can we find them again elsewhere?

Richard Ward focused on visualising (again, extensively using Tableau Public)  a single dataset, the Proceedings, and covering much of the ground on questions of age in his recent blog post here(I learned along the way that the proper demographic term for the tendency to round ages is age heaping.) He also introduced the topic of occupations/status labels – which are problematic in the Proceedings for a number of reasons – and hopefully this will be covered in his next blog post. [slides]

Barry and Lucy Williams rounded off the session by looking at the challenges involved in visualising life grids. Barry’s previous research on 600 prisoners used a wealth of different sources including licenses, medical sources, and other prison records, as well as civil data, and tried to build up as complete a picture as possible of each prisoner’s whole life: this was summarised in life grids. We looked at interesting options for visualising the life of a single prisoner – but how to multiply up to thousands of them? [blog post]

The following discussion introduced a number of suggestions and possible ideas and resources to follow up. Certain themes however, resurfaced throughout the day as key issues:

The importance of seeing data visualisations as part of a process with changing needs and purposes over the course of the project, and for different people. Part of the challenge is that we want to cater not just for the specific research agendas of the project team members but also for a range of other researchers.

The twin challenges of scaling up and the very long period of time we’re covering; but also the sheer variety of different types of source and data that we’re dealing with. The Proceedings are a very different kind of record from the (mostly) highly structured tabular data of Founders and Survivors, and from the English imprisonment records we’ll be working with.

It was all in all a great day! We were bowled over by the wealth of ideas from our three external speakers and the additional input of everyone who attended for the day, not least Andrew Prescott: thanks to everyone who came for making it such an enjoyable and stimulating event. And I’d add a final thank you to Deb Oxley for organising the event and being a splendid host.

Visualising Data Workshop Report: part 1

The first half of the workshop consisted of speakers we invited to introduce the ways in which they have used visualisation in research, and look at how these could be useful to the Digital Panopticon and researchers attending the event. I’ve included as many links to relevant resources as I could find. (See also the Storify of the event.)

Professor Min Chen of the Oxford e-Research Centre got the day off to a great start. He treated us to a dizzying array of examples of different kinds of visualisations, emphasising the importance of who visualisations are being created for. He surveyed the long history of data visualisation and outlined four levels of visualisation:

  1. disseminative (‘this is’) – presentational aids for dissemination
  2. operational (‘what?’) – enable intuitive and speedy observation of captured data
  3. analytical (‘why?’) – investigative, can be used to examine complex relationships
  4. inventive (‘how?’) – aid improving existing models, methods etc

He also got us to think about ‘modes’ of visualisation, the different perspectives/needs of analysts, presenters and viewers. Question asked: ‘what would be a visual language for the Digital Panopticon?’ – taking into account the different kinds of data we’re working with.

These were just some of the examples!

  • Poem Viewer from the Imagery Lenses for Visualizing Text Corpora project (Oxford and Utah collaboration) – designed to support close reading by visualising the sounds of poetry.
  • Temporal Visualization of Boundary-based Geo-information Using Radial Projection – visualising movement of 200 glaciers over 10 years (recorded in satellite images). This was highly challenging: line graphs were too messy, maps not very helpful; a solution was found in radial visualizations.
  • Visualizing facial dynamics – humans are very good at expression recognition, but computers are terrible; project investigating methods to do this
  • Use of glyphs (simple stylised icons) rather than text labels in complex workflow diagrams, and to enable display of multiple measurements simultaneously.
  • Idea of parallel coordinates for visualising multi-dimensional data. (Lots of interest in this!)
  • How to visualise time without animation? – summarising into a single picture can help to see patterns.

Next, William Allen of the Oxford Migration Observatory talked about ‘Doing the Best with Data: critical realism and visualisation’. The Observatory’s goals are to communicate social science research beyond academia; migration is complex and doing this accessibly is challenging, so they make extensive use of visual techniques.

Visualisations are appealing, as they appear to offer comprehensive and independent windows, but actually achieving this needs to approach visualisation as an iterative and critical process. Use of critical realism approach as a lens for evaluation, critical testing of given categories. Rather than ‘what works?’ it’s better to ask ‘what about this visualisation works, for whom in which contexts, for what purposes?’

The media monitoring project was set up to monitor and analyse systematically what the press actually say about migration, over a period of time. Analysis of how press portrays migrant groups uses corpus linguistic methods (43 million words for 2010-12!). Allen showed us a number of visualisations using the tool Tableau Public (which some members of DP team have also been using).

Allen spoke of the ‘frontiers of visualisation’

  • political: how data/research are used by range of actors, decisions made through research
  • technical: the software and built-in assumptions/settings
  • virtual: interactivity, challenges of opening analysis up to public stakeholders

Questions and problems arising from the Observatory’s work: how do we visualise large datasets and patterns in them? Every decision comes with assumptions about what works. Also emphaised the danger that visualisation software can be a black box – eg, misleading on scale.

Additional resource: The Observatory website has a terrific page of data and resources with ‘ready-made charts and maps on migration in the UK as well as a description of key data sources and their limitations’, and a create your own chart facility. Go and play!

Our third speaker, Arthur Downing (Oxford), gave a presentation on Network Analysis and Visualisation for historians.

A network is a particular set of connections between agents: network analysis is analysis of the patterns of these connections (‘nodes’ and ‘links’). It differs from standard social science methodology (which tend to chop up objects by categories like race and gender and then looks at averages), in that network analysis starts with connections between objects/actors and then looks at their attributes. This is important because there can be different patterns of connections within superficially similar scenarios.

Some fascinating case studies he introduced:

Downing’s own work on 19th-century Friendly Societies – a network analysis of proposers and seconders showed that top 20% of recruiters were responsible for 80% of members. But using ‘eigenvector centrality’ (which takes into account degree of node and degree of nodes connected to each node), also showed that some people were important even though they weren’t large recruiters.

Network analysis for maps can show more complex patterns than standard maps:

  • Spread of Freemasons in the US – on a conventional map this just looks like a ‘frontier’ movement, but when mapped as a network, a  different picture emerges with more complex directions of flows
  • Social networks between Australian lodges – most migration is short distance and internal, though migration from England and Wales is very important

Pitfalls and problems:

  • identifying the boundaries of networks can be difficult
  • sampling is hard to justify as any missing ties can skew interpretation
  • longitudinal analysis is difficult – network analysis by definition is a snapshot in time; but may want to know how long does a tie persist. One answer is to breaks down into phases and look at different periods

Conceptually this is very different to standard statistics: ‘analysis of an endogenous system where endogeneity is what is interesting’, but potentially a great method for social history since it’s all about exploring complexity.

In subsequent discussion, concerns about ideological assumptions going into visualisations and how to communicate them to the user – but a reminder that this is a problem with traditional charts and tables too, with no simple answer.

We were deeply grateful to all three speakers for providing us with so much food for thought, and so many ideas to follow up!

[Part 2 of the report to follow shortly…]

Event: Visualising Data Workshop, Oxford, April 2014

We are delighted to be able to announce our first project workshop on Visualising Data, part of our Epistemologies research theme. We anticipate that the workshop will be of interest to many people (not just from large projects!) interested in the potential benefits and pitfalls of visualising large historical datasets.

Along the way, we’ll be reflecting on one of our key research questions:

What can visualisation techniques tell us about the overall shape/distinctive patterns in the data, and what does this reveal about the various processes by which the data were created, and their constraints/limitations?

We’re in the process of exploring data visualisation techniques that will enable us to analyse the datasets both individually and collectively, and members of the project team will talk and invite discussion about both the academic and technical challenges this presents. But we also have three excellent external speakers to provide perspectives from a range of fields and projects: Rob Procter (Warwick), Min Chen (Oxford) and William Allen (Oxford).

It’s an afternoon workshop which we hope will enable as many UK-based people as possible to make a one-day trip of it.

Download the Visualising Data Flyer for full programme details.

Workshop Information

When: 2pm-6pm, Monday 14 April 2014
Where: Wharton Room, All Souls College, High St, Oxford, UK.
Twitter: #dpdataviz

How to attend: Email Sharon Howard (sharon.howard@sheffield.ac.uk) to register. Places are very limited, so contact asap!

Thinking about Dates and Data

Our headline dates (1780-1925) are far from being the whole story when it comes to thinking about data collection and record linkage. One of our stated objectives in our original application elaborates:

to chart the fortunes of all Londoners convicted at the Old Bailey between the departure of the First Fleet to Australia (1787) through to the death of the last transported Londoner in Australia in the early 1920s

But in order to do this, we need to look at data from significantly earlier than 1787, or even 1780. Our interest in convicts doesn’t start at the moment of the Old Bailey trial that sent them on their journeys to Australia. For 18th-century offenders, we don’t have census or civil registration records that we can use, so our focus will be on attempting to trace earliest contacts with the criminal justice system. But if we go too far back, we’ll spend a lot of time and computing resources processing data we don’t need, which will increase problems with noise and false positives (especially when we’re looking for needles in haystacks of unstructured data like newspaper or sessions papers).

Still, it seemed worth checking a more simple question initially. We knew some of the convicts transported in 1787 would have been held in the hulks for several years, as authorities sought a replacement for the American colonies (those pesky Revolutionaries). How long exactly? We wanted to pin down a more precise date than 1780.

Attribution: State Library of New South Wales

The First Fleet entering Port Jackson, January 26, 1788 (State Library of New South Wales)

The Old Bailey Online isn’t a very useful source for this question, however convenient it might be (a few moments with the stats search tells me, for example, that 1258 people were sentenced to transportation between 1781 and 1786), because sentences given after trials don’t necessarily reflect actual outcomes: not everyone who was sentenced to transportation was actually transported; and not everyone who was transported had been given that sentence in court (a significant proportion of of death sentences was subsequently commuted to transportation). In addition,between the collapse of transportation to the American colonies and the establishment of Australia as the primary recipient of transported convicts, there were experiments with transportation to other colonies.

I needed different sources, based on the actual transportation records, so it was a chance for me to start learning about the transportation and Australian datasets I’m not familiar with. In fact, there is plenty of source material: many of the transportation records routinely included information about the convicts’ trials – offence, court, and date convicted. Moreover, a number of projects have already produced readily usable and accessible datasets based on these sources.

I started with the State Library of Queensland British Convict Transportation Registers database (BCTR), created from Home Office registers (TNA HO11, for those who’re interested). We’ve already indexed this data in Connected Histories. The CH version wasn’t designed for this kind of data analysis, however, and to run individual searches would have been a long slow job, so I downloaded the full dataset and played with it (using OpenRefine) until I got the information I wanted. The earliest trial in there, it seemed, was that of John Martin, in July 1782.

The second relevant and easily accessible dataset was the First Fleet database (FF-DB), which is also available to download. This is a smaller dataset, containing the 780 or so convicts transported on the First Fleet, of whom 327 had been sentenced at the Old Bailey. Unlike the BCTR, it’s been compiled from a number of different primary and secondary sources. In FF-DB, the earliest Old Bailey trials were from 1781. The earliest trial of all was that of Samuel Woodham and John Ruglass, at the sessions of 30 May 1781.

Why hadn’t I found these in BCTR? Because, it transpired on reading the entries, in each case their journey to Australia was actually their second convict voyage. They’d escaped from their first convict destination and had been convicted of returning from transportation around 1784-5. BCTR only gave the date of the second conviction that actually put them on the ships to Australia, whereas FF-DB records both. Most of the 14 FF-DB convicts from 1782 trials had also returned from transportation (several had been involved in the Mercury mutiny) and been re-sentenced at a later date.

Don’t ya just love the way a ‘simple’ historical question is never so simple after all?

A different question I decided to ask the data: setting aside 1781-2 outliers, what was the more normal interval between conviction and departure for Australia for the Old Bailey First Fleeters? The following table is taken from the FF data (without taking the “re”-transported into account): 213 (65%) were originally tried in 1784 or earlier. Those who’d spent less than 3 years in the hulks could presumably consider themselves the lucky ones.

Year of conviction Number of convictions
1781 4
1782 14
1783 48
1784 147
1785 37
1786 49
1787 28

Now I needed to investigate the age range of the First Fleet convicts, which would help me to work out the likely earliest dates of contact with the justice system. Both the transportation and Old Bailey Online data contain at least some information about ages, although 18th-century information on this is often imprecise and not always accurate. I wasn’t too worried about this, since they didn’t need to be exact for this purpose.

First-Fleet-OB-ages2

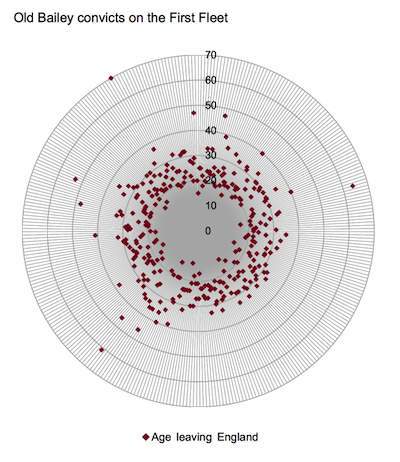
What are the recorded ages of the First Fleet convicts in FF-DB? There is age information for 309 out of the OB sample of 327 (bearing in mind these are recorded as ages at the time of departure, so they’d have generally been a few years younger at the time of trial). I think it will hardly come as a major surprise to 18th-century crime historians that the majority (64%) were between 20 and 30 years old, and the vast majority (95%) were over 15 and under 40.

That age data could be skewed in various ways, though: it’s conceivable that those selecting prisoners for the First Fleet tended to choose younger people who’d be more likely to survive the passage, and be stronger workers at the other end;  on the other hand, though, we might reasonably speculate that very young offenders would be less likely to be transported.

Age data is available for only about 3% of Old Bailey Online defendants between 1740 and 1780 (contrasting sharply with the later 19th-century Proceedings – which in itself tells us a lot about changes in record-keeping generally and surveillance of the criminal elements in society in particular). We have no idea how representative that 3% was so I’m wary of taking any hard numbers from it. (And again, I can imagine that very young offenders might be slightly less likely to appear at the Old Bailey than at lower courts.) But  it does show a reasonably similar profile to FF-DB, with very, very few defendants under 15, though rather more between 40 and 50 – which might (if we could really trust it) back up my notion that the First Fleet convicts tended to be selected from younger prisoners.

Using the age of 45 (in 1787) as an upper limit would give a birth year c. 1742 – let’s round that down to 1740 for convenience. So, if they were unlikely to appear in criminal justice records much before the age of 15, that takes us to 1755. That too will not be quite the final word: we’ll probably do manual searches in earlier records for the handful of First Fleeters aged over 45, and for individuals who appear to have exceptionally rich stories. But in terms of data collection for automated searching/processing, that is likely to be close to our “real” starting date.

PhD Studentships (2): Digital Dark Tourism / Sentencing at the Old Bailey

We have funding for two (UK/EU) PhD students, based at the University of Liverpool, to start in February 2014.

Application deadline: Friday 10 January 2014

More information

Studentship 1: Digital Dark Tourism

The increased availability of digital resources has brought criminal justice data within easy reach of thousands if not millions of people. This has coincided with the commercialization of decommissioned gaols, courts and police stations. Gaol Museums often have highly visual publicity and online material. This thesis will examine the presentation of criminal justice history in museums and in printed material. It will explore the public interaction with these forms, and the motivations of the museum and heritage managers in digitizing, publicizing, and presenting former penal sites.

Studentship 2: Sentencing at the Old Bailey 1780-1880

This thesis on “Sentencing factors and disposals” will explore and examine all of the contextual linked-data on the life-course of the people sentenced to imprisonment at the Old Bailey. There are a variety of sentencing factors that must be taken into consideration when sentencing offenders: severity of the offence, whether the case is heard on indictment, and so on. There are also a number of other factors which may have played a part – the perceived social status of the defendant, the number of previous convictions, the perceived status of the complainant, and so on. This thesis will use data retrieved from a number of online digital sources  to investigate the overt and hidden factors that may have influenced whether a convicted felon was found not-guilty, imprisoned or transported.