Computers are brilliant microscopes. They make it easy to find needles in haystacks. Want to find references to the famous lawyer William Garrow amongst the millions of words in the printed reports of trials held at the Old Bailey, for instance? A keyword search produces the results in less than a second. Without computers it would take months. Likewise, as I explained in a recent post, through the techniques of data visualisation computers can be used to spot (what would otherwise be largely imperceptible) errors within the massive datasets that we are drawing upon in the Digital Panopticon project.
But computers are also fantastic macroscopes — today’s powerful digital technologies allow us to stand back from our sources and view them in their entirety. We can see the big picture, presenting complex and large-scale patterns in simple but effective ways. Microscopes allow us to see the infinitely small. Telescopes reveal the infinitely great. Macroscopes, meanwhile, peer in to the infinitely complex, allowing us to explore combinations, relationships and interactions between multiple elements.
By visualising the information recorded in the British Convict Transportation Registers, I’ve recently put penal transportation to Australia in the eighteenth and nineteenth centuries under the macroscope. This has produced some interesting insights into the relationship between Australian penal colonies, terms of transportation and how these changed and interacted over time.
The British Convict Transportation Registers database provides information on more than 123,000 offenders who were transported to Australia between 1787 and 1867. It’s a fantastic resource, and it will be at the heart of the Digital Panopticon project’s efforts to chart the criminal lives of London convicts sent to Australia. In charting these lives, we need to address some overarching starting questions. How many London convicts were actually transported to Australia for their crimes? Which parts of Australia were they sent to? How many years abroad did they face according to their sentences? Did this change over time, and what was the relationship between these different elements? Visualisations can help us to explore these questions across the long term and a large scale.
The total number of London convicts transported to Australia fluctuated greatly over the late eighteenth and nineteenth centuries, as Graph 1 below demonstrates. Relatively few convicts were transported in the years 1793–1804 when the Revolutionary War monopolised Britain’s shipping resources. With the end of the Napoleonic War in 1815 there were however large and rapid increases in the numbers of London convicts sent to Australia, reaching a massive peak in the 1830s. Thereafter, numbers gradually fell until the eventual abandonment of penal transportation in the 1860s. Interestingly, this pattern reflects a wider inverse relationship between the numbers of convicts transported and the years in which Britain was engaged in war throughout the eighteenth and nineteenth centuries.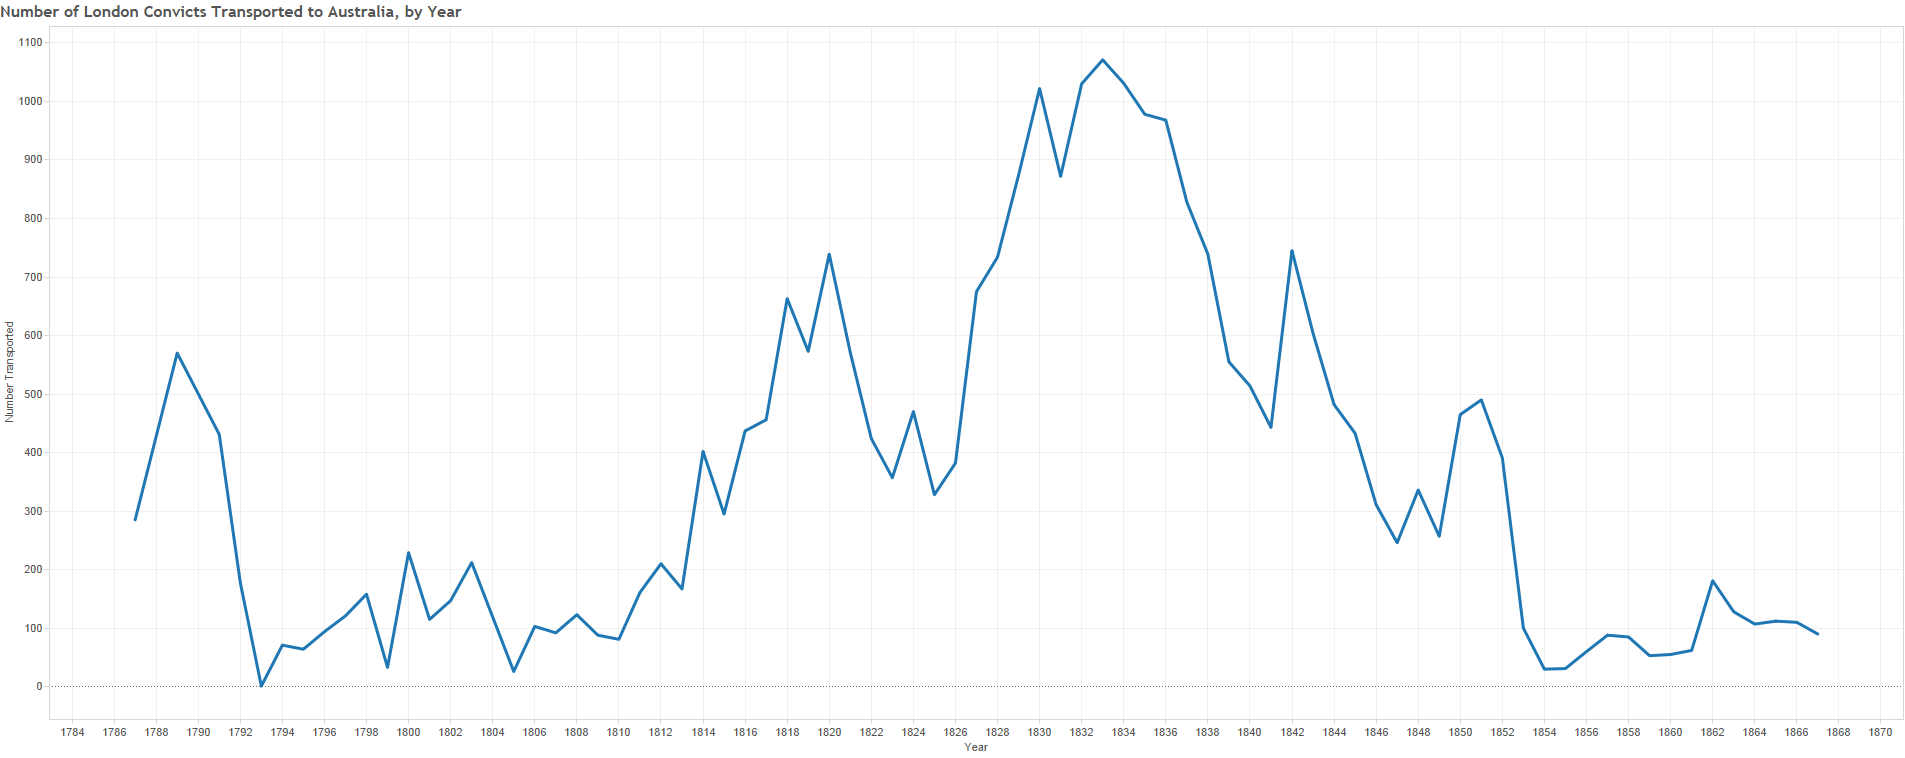
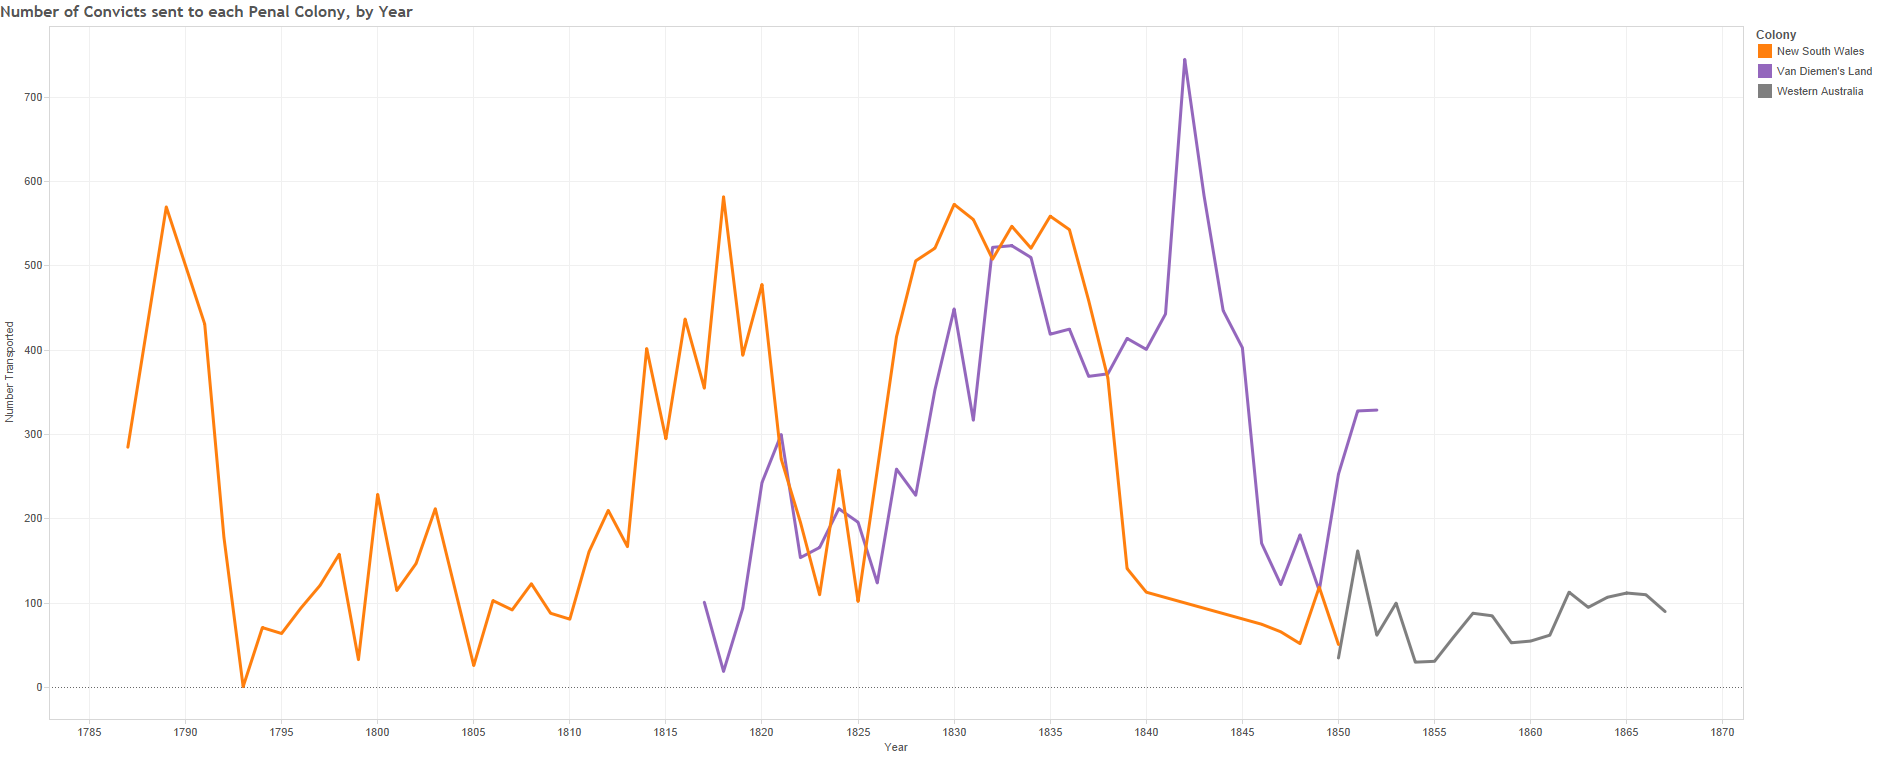
What Graph 1 doesn’t reveal is that the places in Australia where convicts were sent to changed over time. The individual penal colonies to which London convicts were sent operated at different times. As Graph 2 below shows, New South Wales was the first penal colony in Australia, and was later used alongside the penal colony of Van Diemen’s Land between the late 1820s and 1840, when transportation to Australia was at its peak. Following this, Van Diemen’s Land was used almost exclusively, until the 1850s, when Western Australia was the sole transportation location in Australia.
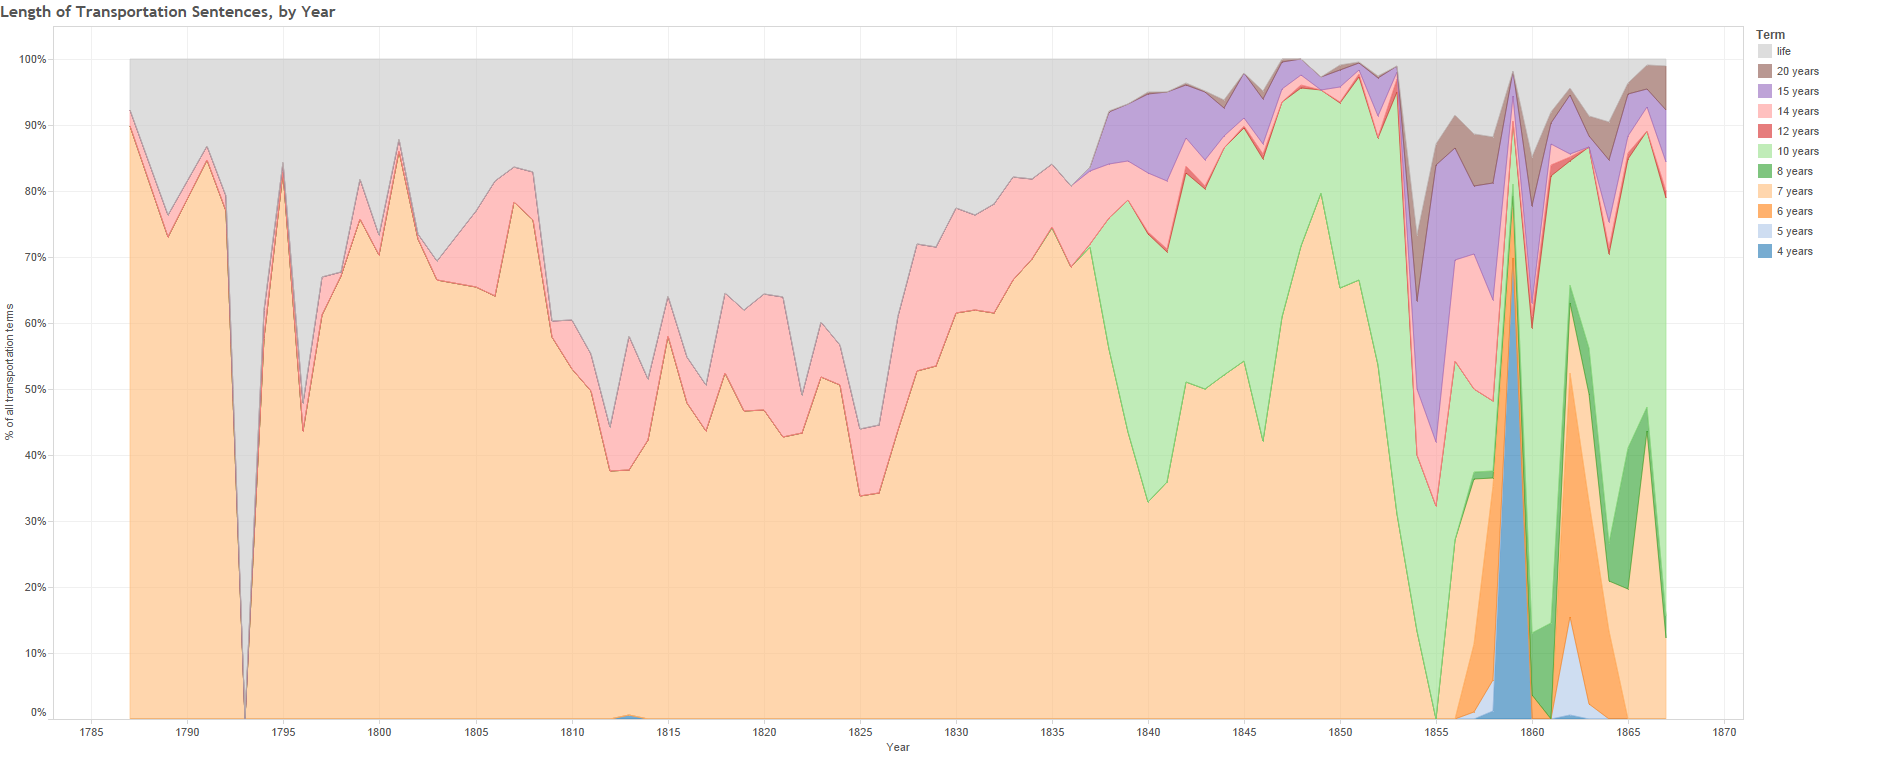
If the locations of penal transportation to Australia changed over time then so too did the lengths of time which offenders were sentenced to abroad. Between 1787 and the virtual abandonment of New South Wales as a penal colony in the late 1830s, as Graph 3 highlights, offenders were sentenced almost without exception to a term of 7 years, 14 years or life. Between 1840 and 1850, when Van Diemen’s Land was used exclusively, terms became more varied, with greater use of 10 and 15 year sentences. And especially after 1853, when Western Australia became the sole destination for transportees, an even greater variety of terms were put to use. This more nuanced tariff in transportation sentences was likely introduced to make transportation more favourable to penal reformers who increasingly viewed the practice with concern.
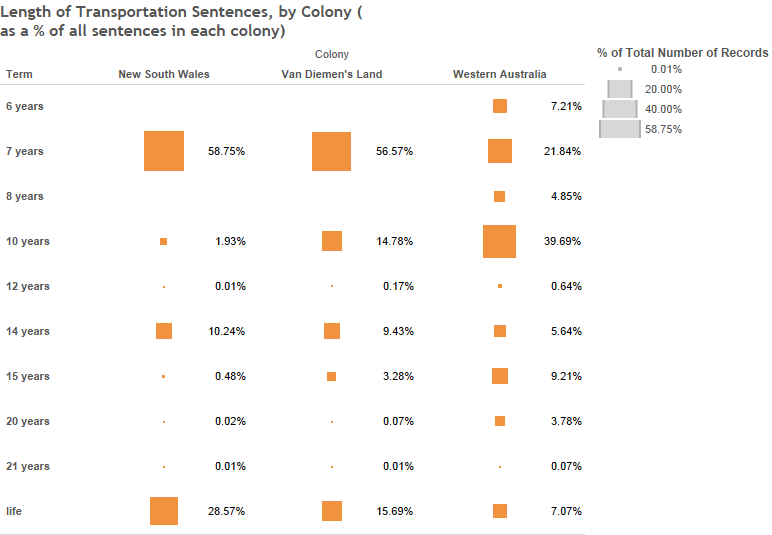
These changes in penal colony and terms of transportation were intimately linked, and the interaction between the two is clearly captured in Graph 4. The colonies operated at different times, and the law which underpinned them and the terms of transportation which could be imposed also changed in accordance. In short, the convicts who found themselves on the shores of New South Wales were primarily one of two kinds: either those sentenced to 7 years transportation; or those sentenced to a whole life abroad. By contrast, London convicts landing some 2,000 miles away on the shores of Western Australia and on the eve of transportation’s demise in the 1850s would each have had subtly different terms to serve out.
Through the macroscope of computer-generated visualisations, we can see these complex patterns and interactions in their entirety, spanning the breadth of Australia and the length of a century, taking in the lives of tens of thousands of individuals along the way.
Thanks for linking to my blog. This is a fascinating study of transportation.
Dear Richard
Such an interesting post, and reinforces State Library of Queensland’s commitment to make our datasets freely available online for use in research and innovative re-use. The convicts dataset was created over many years by a dedicated team of staff and volunteers and it is so great to see it being used in this macroscopic way.
We look forward to seeing more outcomes of this work.
Kind regards
Margaret Warren
Coordinator, Discovery Services
State LIbrary of Queensland